This article will cover how to get visibility of your test coverage in Go. If you’re not comfortable with the basics of testing in Go, please checkout my earlier article aimed at beginners.
Test coverage Link to heading
Test coverage gives you a high-level overview you how much of your production code was invoked in your tests (e.g. as a percentage), but it can also give you a lower-level view of exactly which lines are invoked or missed. Before we dive deeper into the ‘how’, let’s make sure we understand why we care about test coverage. Test coverage is a terrible metric for evaluating the quality of your tests. Repeat after me:
High test coverage does not imply high-quality tests.
So what’s the purpose of test coverage then? Link to heading
In my opinion, test coverage serves two purposes:
Firstly, it lets you quickly identify which lines have not been hit by tests.
This could indicate that your tests aren’t comprehensive enough: “Oops, this if statement wasn’t tested, but it should have been. Let’s add another test”.
However, it could also identify impossible paths in your code: “We’ve already validated this value elsewhere so this can never happen”.
Moreover, paired with a good Continuous Integration setup, you can identify if a change will remove tests prematurely, by warning you when the coverage of your pull request is lower than the base branch.
How to report test coverage in Go Link to heading
The go tool supplies us with all the tools we need; no third-party solution required:
# Write a "coverprofile" to a filed called coverage.out
go test -coverprofile=coverage.out

# Invoke the 'cover' go tool, and ask it to render the coverprofile file as HTML.
# This should open your default web browser.
go tool cover -html=coverage.out
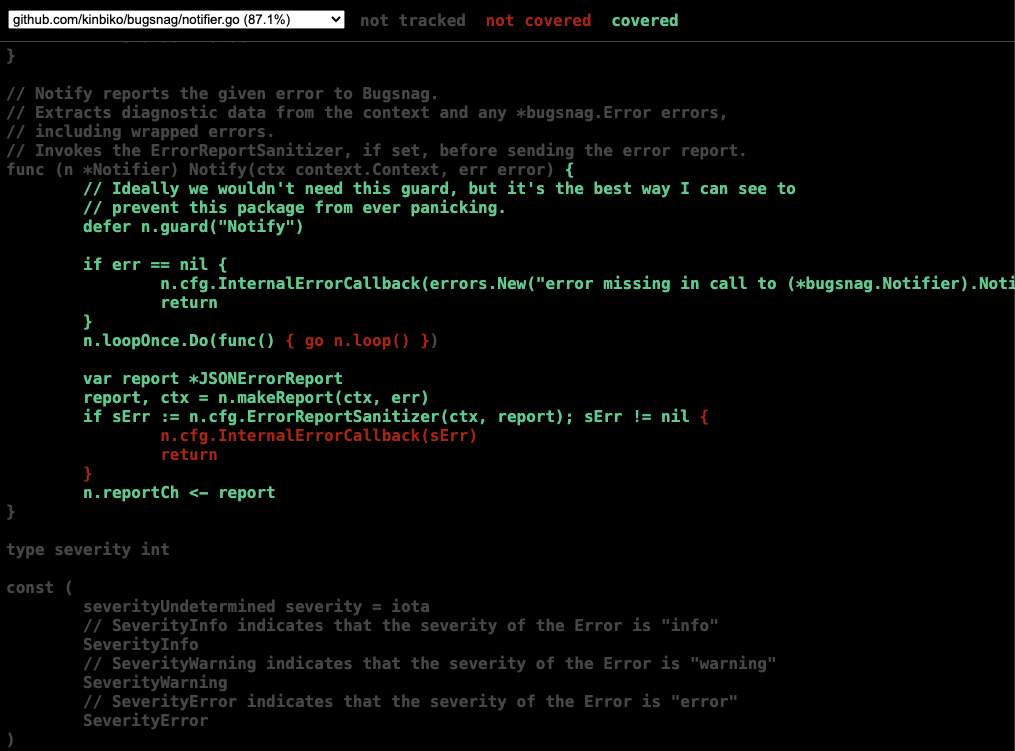
This shows you exactly how much of each production file was covered, and renders your source code in green if the particular line was covered by the tests, and red otherwise. Type definitions, comments, and other “non-runnable” code are greyed out, as it doesn’t make sense to count these lines as part of our coverage.

You can also see a report of your coverage report on a per-function basis:
# Running coverage against github.com/kinbiko/bugsnag and requesting
# per-function output
$ go test -coverprofile=coverage.out github.com/kinbiko/bugsnag && go tool cover -func=coverage.out
ok      github.com/kinbiko/bugsnag    0.159s    coverage: 87.5% of statements
github.com/kinbiko/bugsnag/configuration.go:67:  validURL                  100.0%
github.com/kinbiko/bugsnag/configuration.go:75:  populateDefaults          100.0%
github.com/kinbiko/bugsnag/configuration.go:92:  validate                  100.0%
github.com/kinbiko/bugsnag/configuration.go:124: makeRuntimeConstants      54.5%
github.com/kinbiko/bugsnag/context.go:21:        Serialize                 60.0%
github.com/kinbiko/bugsnag/context.go:39:        Deserialize               55.6%
github.com/kinbiko/bugsnag/context.go:86:        val                       100.0%
github.com/kinbiko/bugsnag/context.go:127:       WithBreadcrumb            100.0%
github.com/kinbiko/bugsnag/context.go:143:       makeBreadcrumbs           100.0%
github.com/kinbiko/bugsnag/context.go:180:       WithUser                  100.0%
github.com/kinbiko/bugsnag/context.go:196:       WithBugsnagContext        100.0%
github.com/kinbiko/bugsnag/context.go:213:       WithMetadatum             100.0%
github.com/kinbiko/bugsnag/context.go:226:       WithMetadata              100.0%
github.com/kinbiko/bugsnag/context.go:243:       Metadata                  100.0%
github.com/kinbiko/bugsnag/context.go:251:       initializeMetadataTab     100.0%
github.com/kinbiko/bugsnag/context.go:301:       updateFromCtx             38.9%
github.com/kinbiko/bugsnag/context.go:332:       getAttachedContextData    100.0%
github.com/kinbiko/bugsnag/error.go:32:          Error                     100.0%
github.com/kinbiko/bugsnag/error.go:47:          Unwrap                    66.7%
github.com/kinbiko/bugsnag/error.go:61:          Wrap                      100.0%
github.com/kinbiko/bugsnag/error.go:70:          Wrap                      100.0%
github.com/kinbiko/bugsnag/error.go:84:          makeStacktrace            100.0%
github.com/kinbiko/bugsnag/error.go:120:         makeModulePath            66.7%
github.com/kinbiko/bugsnag/notifier.go:44:       New                       85.7%
github.com/kinbiko/bugsnag/notifier.go:72:       Close                     100.0%
github.com/kinbiko/bugsnag/notifier.go:93:       Notify                    75.0%
github.com/kinbiko/bugsnag/notifier.go:129:      loop                      100.0%
github.com/kinbiko/bugsnag/notifier.go:149:      shutdown                  70.0%
github.com/kinbiko/bugsnag/notifier.go:172:      makeReport                100.0%
github.com/kinbiko/bugsnag/notifier.go:197:      sendErrorReport           85.7%
github.com/kinbiko/bugsnag/notifier.go:221:      makeUnhandled             100.0%
github.com/kinbiko/bugsnag/notifier.go:234:      makeSeverity              83.3%
github.com/kinbiko/bugsnag/notifier.go:246:      severityReasonType        100.0%
github.com/kinbiko/bugsnag/notifier.go:265:      makeExceptions            82.4%
github.com/kinbiko/bugsnag/notifier.go:297:      makeJSONApp               100.0%
github.com/kinbiko/bugsnag/notifier.go:306:      makeJSONDevice            75.0%
github.com/kinbiko/bugsnag/notifier.go:321:      memStats                  84.6%
github.com/kinbiko/bugsnag/notifier.go:345:      osVersion                 66.7%
github.com/kinbiko/bugsnag/notifier.go:352:      makeNotifier              100.0%
github.com/kinbiko/bugsnag/notifier.go:360:      extractLowestBugsnagError 100.0%
github.com/kinbiko/bugsnag/notifier.go:374:      guard                     100.0%
github.com/kinbiko/bugsnag/session.go:30:        StartSession              100.0%
github.com/kinbiko/bugsnag/session.go:45:        flushSessions             100.0%
github.com/kinbiko/bugsnag/session.go:57:        publishSessions           82.4%
github.com/kinbiko/bugsnag/session.go:102:       makeJSONSession           100.0%
github.com/kinbiko/bugsnag/session.go:116:       makeJSONSessionReport     100.0%
github.com/kinbiko/bugsnag/session.go:135:       uuidv4                    100.0%
total:                                           (statements)              87.5%
A note on covermode and concurrent programs
Link to heading
go test has a parameter called covermode which tweaks how the Go tool should think about “covering a line”.
Basically your options are “lines are either missed or hit” or “let’s count how many times a line is hit”.
The former is used by default, and is the least expensive.
You can get more of a ‘heatmap’ feature (in the rendered HTML) by setting the -covermode=count, however I recommend taking things a step further to avoid headaches.
Namely, use -covermode=atomic to ensure that the lines hit are counted accurately even in concurrent programs.
$ go test -coverprofile=coverage.out -covermode=atomic
This is significantly more expensive, but for most project the additional compute resource is surely negligible.